In the previous chapters of this series, we set up a RAN and performed our first UE attach. At this point, the RAN is fully operational. The next step is to add monitoring.
The srsRAN gNB exposes detailed runtime metrics in JSON format. In this post, we deploy the full visualization pipeline and integrate it with the srsRAN gNB. I will show how to deploy the Grafana stack both on bare metal using Docker and on Kubernetes using Helm.
How the srsRAN Metrics Pipeline Works
The srsRAN Grafana setup consists of three components:
- Telegraf subscribes to the gNB metrics port and parses the JSON stream.
- InfluxDB 3 stores the metrics as time-series data.
- Grafana visualizes the data using ready-made dashboards.
At runtime, the srsRAN gNB opens a TCP socket and continuously streams JSON metrics. Telegraf connects to this socket, parses the incoming data, and writes it into an InfluxDB 3 database. Grafana then queries this database to visualize the metrics.
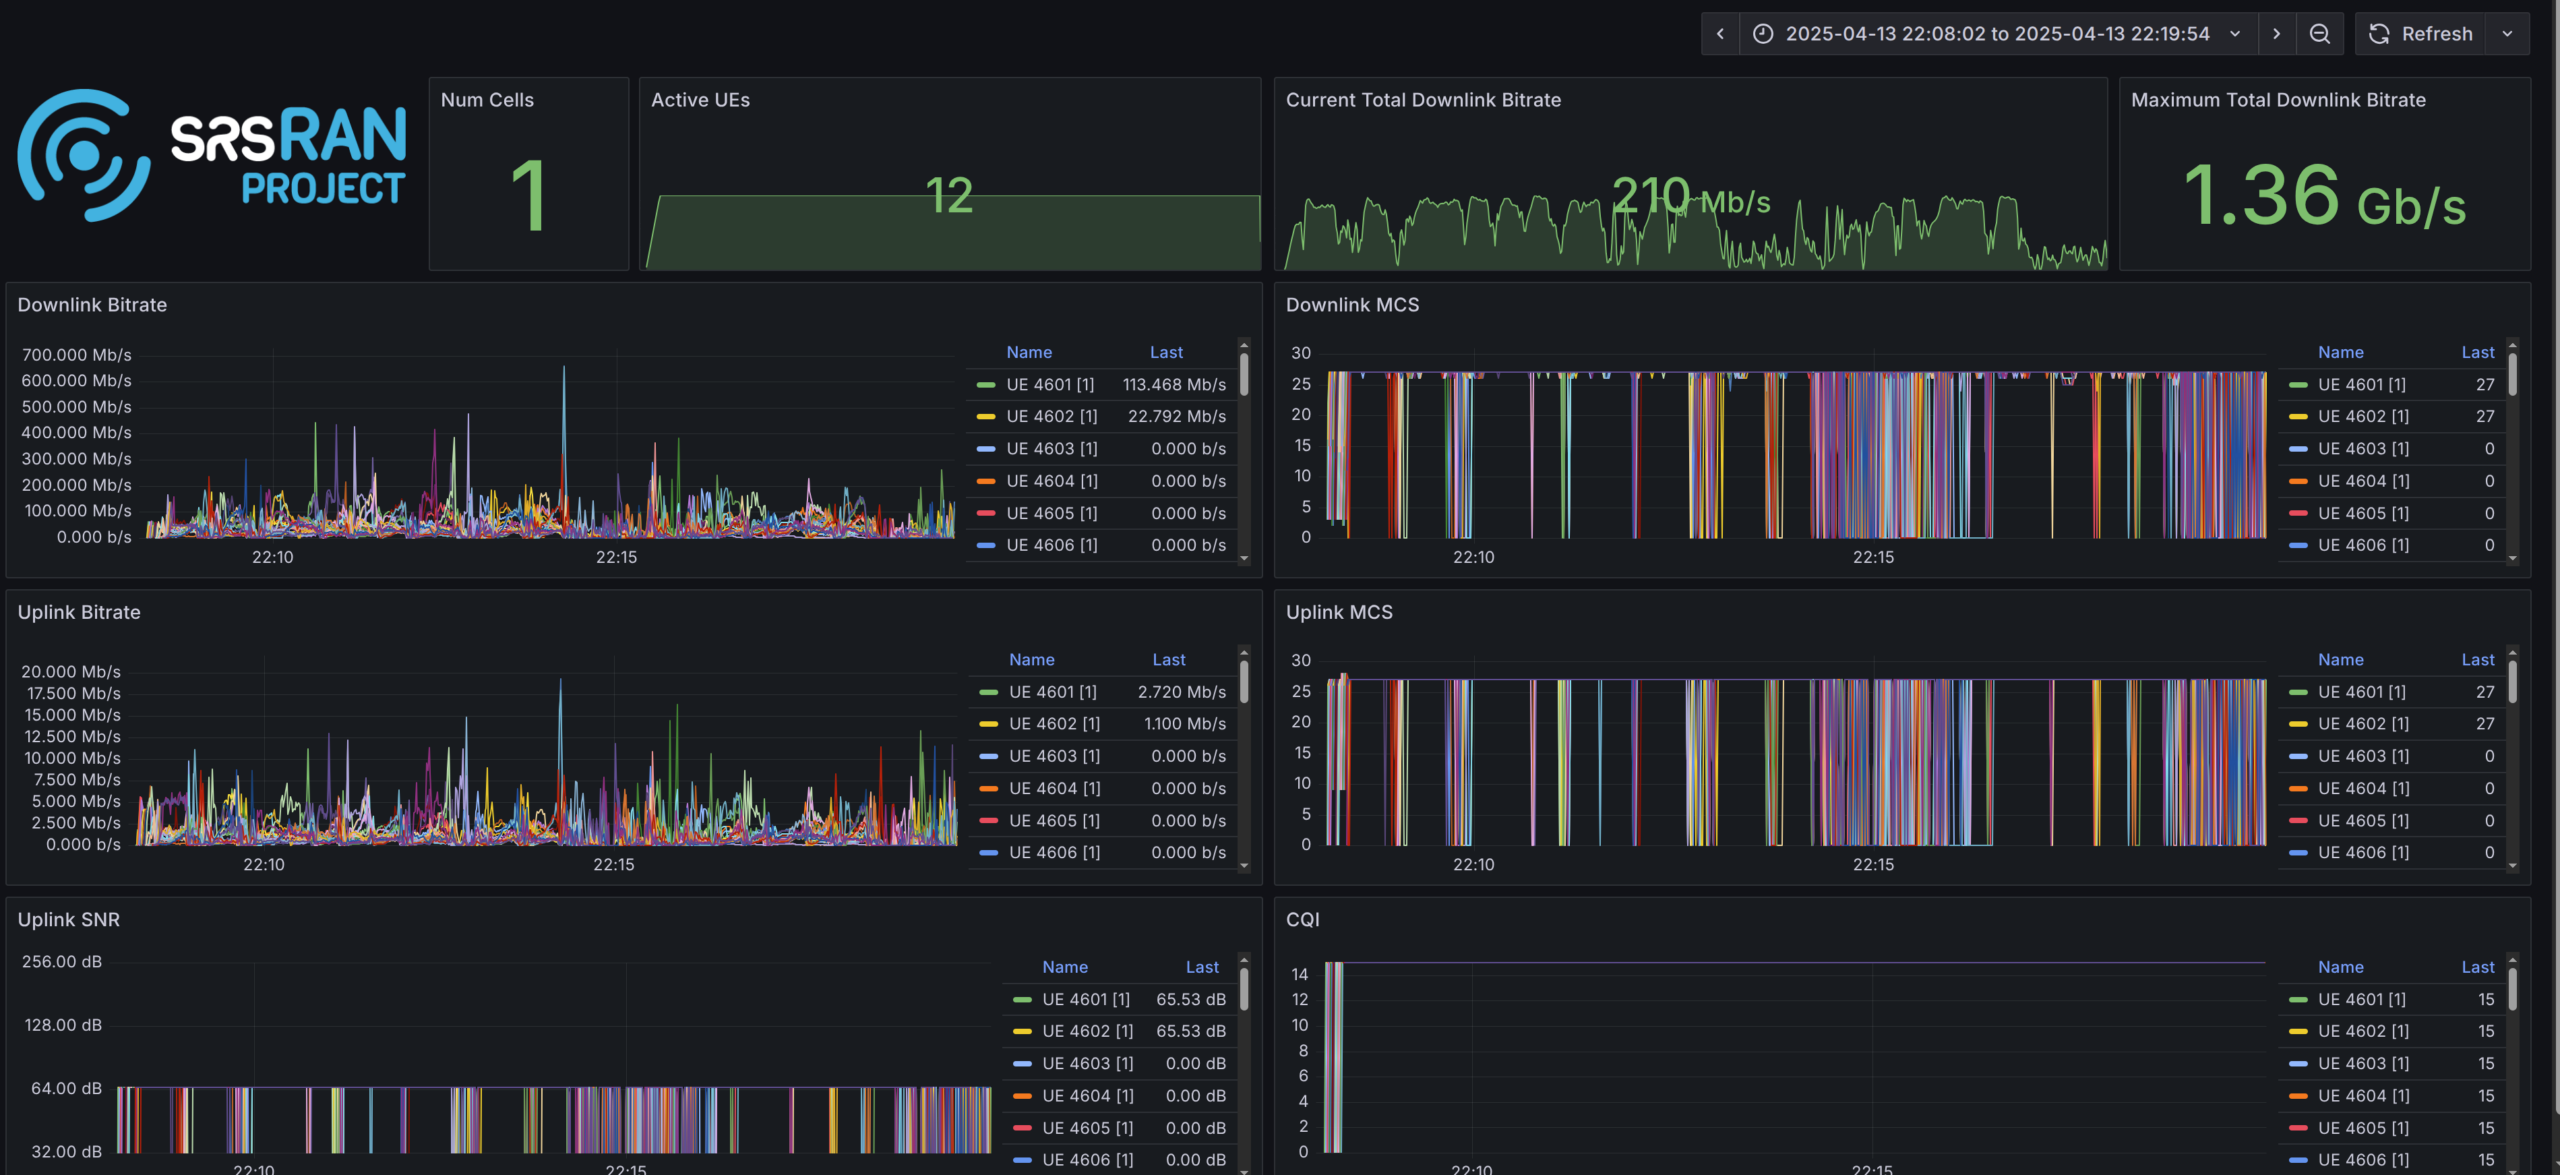
Metrics are available for several layers, including RU, DU low, MAC, scheduler, RLC, and PDCP. The provided Grafana setup offers a wide range of dashboards out of the box, and it is straightforward to create custom dashboards tailored to your own requirements.
Configuring the srsRAN gNB
To stream metrics from the gNB, the remote_control section must be enabled.
remote_control:
  enabled: true
  port: 8001
  bind_addr: 0.0.0.0
Setting bind_addr to 0.0.0.0 instructs the gNB to bind to all available network interfaces. After configuring the TCP port, metrics must be explicitly enabled.
Below is an example configuration:
metrics:
  enable_json: true
  enable_log: false
  periodicity:
    du_report_period: 1000
    cu_up_report_period: 1000
    cu_cp_report_period: 1000
  layers:
    enable_ru: true
    enable_sched: true
    enable_rlc: true
    enable_mac: true
    enable_pdcp: true
    enable_du_low: true
Deploying Grafana on Bare Metal
The simplest way to deploy the full Grafana stack is using the Docker Compose setup included in the srsRAN Project repository.
Prerequisites
- Docker
- Docker Compose
Configuring the gNB
Configure the gNB as shown above and enable the layers you want to visualize. Make sure bind_addr is set to 0.0.0.0 so the metrics port is reachable from Docker.
Clone the repository and start the services
To start the stack, clone the srsRAN repository and run Docker Compose. This will automatically build the required images and start the services.
Before running Grafana, Telegraf needs to know the IP address of the gNB. Since the gNB is bound to all interfaces, we can use the Docker host IP. In this setup, the Docker Compose network is configured with the subnet 172.19.1.0/24.
When running on bare metal, use 172.19.1.1 as the IP address where Telegraf can reach the gNB. This corresponds to the Docker host IP in the default Docker Compose network configuration.
You should have the following configuration in your docker-compose.ui.yaml file inside the Telegraf section:
networks:
  metrics:
    ipv4_address: 172.19.1.1
Now build and start the stack:
git clone https://github.com/srsran/srsRAN_Project.git
cd srsRAN_Project/docker
docker compose up grafana
In addition to Grafana, the Docker Compose setup also allows running Open5GS or the gNB itself inside Docker. Refer to the README in the docker directory for more details.
Accessing Grafana
The web interface is available at:
http://<host-ip>:3000Default credentials:
admin / admin1234Deploying Grafana on Kubernetes
The srsRAN Project provides Helm charts for Grafana, Telegraf, and InfluxDB 3. Deploying them on Kubernetes follows the same principles as the Docker setup.
srsRAN Project Helm charts
Start by cloning the Helm repository:
git clone https://github.com/srsran/srsRAN_Project_helmThe Grafana Helm chart is located at:
srsRAN_Project_helm/charts/grafanaThis chart installs three components:
- the srsRAN InfluxDB 3 Helm chart
- the official Telegraf Helm chart
- the official Grafana Helm chart
All components are preconfigured to work together. Only a small number of settings need to be adjusted.
Understanding Kubernetes Hostnames
In Kubernetes, Pod IPs are assigned dynamically and should not be used directly. Instead, services are addressed using DNS hostnames. This allows the deployment to continue working across restarts without manual reconfiguration.
Kubernetes resolves services using the following format:
{service-name}.{namespace}.svc.{cluster-domain}The service name and namespace are usually obvious, but the cluster domain is less visible. You can discover it by inspecting a Pod:
kubectl exec -it <pod> -- cat /etc/resolv.confLook for a line starting with search, for example:
search default.svc.srsk8s.bcn svc.srsk8s.bcn localdomainIn this case, the cluster domain is srsk8s.bcn. A valid hostname would then look like:
influxdb.srsran.svc.srsk8s.bcnCustomizing the Grafana Configuration
To configure the srsRAN Grafana Helm chart, only the hostnames need to be updated. Make sure to replace the namespace and cluster domain as required. The service names should not be changed.
Other parameters such as tokens can be modified, but they must be updated consistently everywhere. For simplicity, I recommend to only adjust the hostnames.
Update the hostname in the following locations:
grafana -> env -> INFLUXDB3_EXTERNAL_URLgrafana -> datasources -> datasources -> urltelegraf -> env -> WS_URLtelegraf -> env -> INFLUXDB3_EXTERNAL_URL
Example config:
Configuring the srsRAN Project Helm Chart
The gNB configuration is identical to the Docker setup. However, on Kubernetes, the metrics TCP port must be exposed via a Service.
Add the following section to your values.yaml file:
metricsService:
  enabled: true
  type: ClusterIP
  port: 8001
  targetPort: 8001
Make sure the port matches the remote_control port in the gNB configuration.
Example config:
Deploying the Helm Chart
Deploy the Grafana stack using:
helm install grafana ./grafana -n srsran -f ./values.yamlAccessing the Grafana Web UI
After the deployment completes, Grafana is accessible via NodePort:
http://<node-ip>:30001Debugging the Grafana Deployment
If the dashboards show no data, the issue usually lies in one of three places:
- gNB → Telegraf
- Telegraf → InfluxDB
- Grafana → InfluxDB
The following sections outline common debugging steps.
Checking Whether Telegraf Receives Metrics
As a first step, enter the Telegraf container and verify that traffic is arriving:
apt update && apt install tcpdump
tcpdump -i eth0 port 8001
If packets are visible, Telegraf is receiving data correctly. If not, verify the following:
Docker
- Docker Compose is running without errors
metricsandremote_controlare enabled- The Telegraf container can reach the gNB IP
Kubernetes / Helm
- The gNB Service exists (
kubectl get services) metricsandremote_controlare enabled- Hostnames match the configuration
- Telegraf can resolve the hostname specified in
WS_URL
Checking Whether Telegraf Can Reach InfluxDB
If Telegraf receives metrics, verify connectivity to InfluxDB.
Docker
- Ping the InfluxDB container IP from the Telegraf container
Kubernetes
- Verify that the Telegraf container can resolve the InfluxDB hostname
Grafana Troubleshooting
To verify Grafana connectivity, open the Grafana admin interface and check the data source status.
Default credentials:
admin / admin1234If Grafana reports that the srsran table is unavailable, this usually indicates that no data has been written to InfluxDB yet. If it reports a connection error, the hostname or credentials are likely incorrect.
Conclusion
With Grafana running, you gain visibility into the internal behavior of your gNB. You can observe RAN-layer metrics as well as system-level metrics of the underlying nodes.
In the next posts, we will take a closer look at managing the RAN at scale using an SMO.